The Big Bear real estate market saw a notable upswing in October, with stronger sales activity and higher prices compared to the prior month, even as inventory tightened heading into the winter season.
🔍 Key Takeaways – October 2025 Big Bear Real Estate Market
- Sales jumped 12% in October, marking the strongest month of 2025.
- Average sales price climbed 16% to $653,498; median price rose 15% to $545,000.
- Average price per sq ft dipped slightly to $374, down 5% from September.
- Active listings fell 16%, from 519 to 438, as inventory tightened for winter.
- Average days on market increased modestly to 116 days.
- Year-to-date prices remain nearly flat compared to 2024, showing overall stability.
- Buyer demand remains strong, particularly for homes near ski slopes and vacation rental opportunities.
📊 Market-Wide Summary
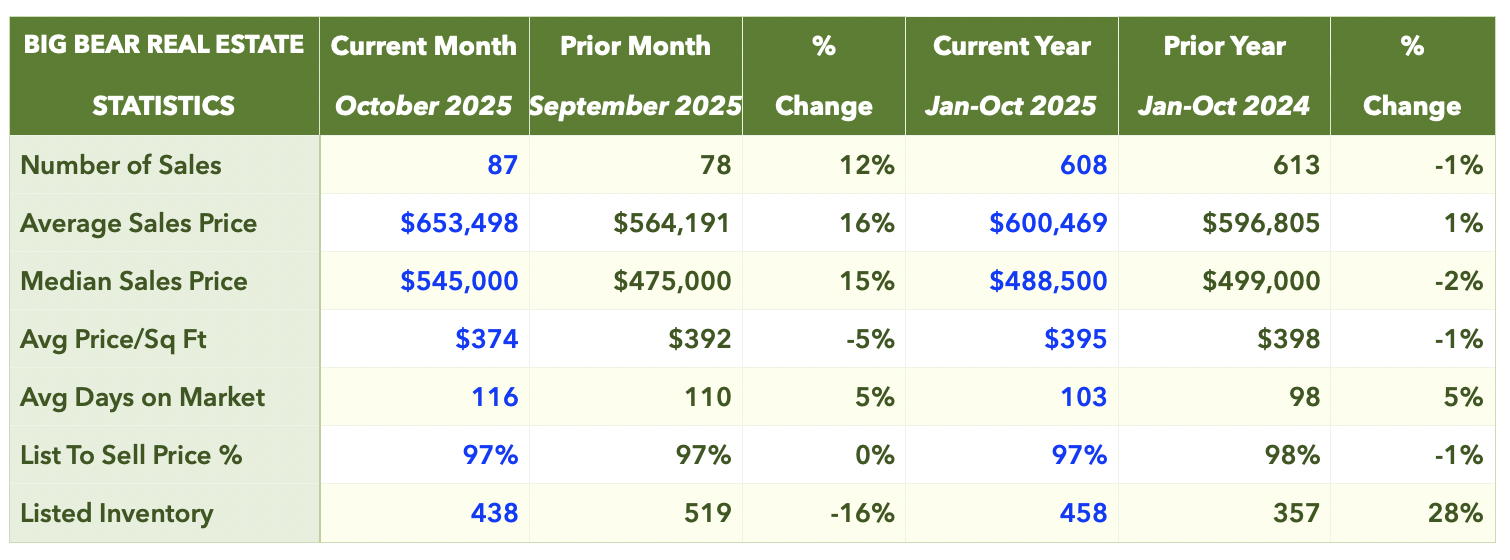
In October, 87 single-family homes were sold in the Big Bear area, up 12% from September. The average sales price rose 16% to $653,498, while the median price increased 15% to $545,000.
Despite these monthly gains, the average price per square foot dipped slightly to $374, down 5% from the previous month.
Year-to-date, prices remain relatively steady compared to 2024. The average sales price through October 2025 is up 1%, while the median price is down 2%. The average days on market crept up slightly to 116 days, reflecting a bit of seasonal slowing. The list-to-sell price ratio held steady at 97%.
One of the biggest changes this month is on the supply side — active listings dropped 16% from September, from 519 to 438 total listings, suggesting sellers are beginning to pull homes off the market as we move toward winter.
🏠 Inventory Trends
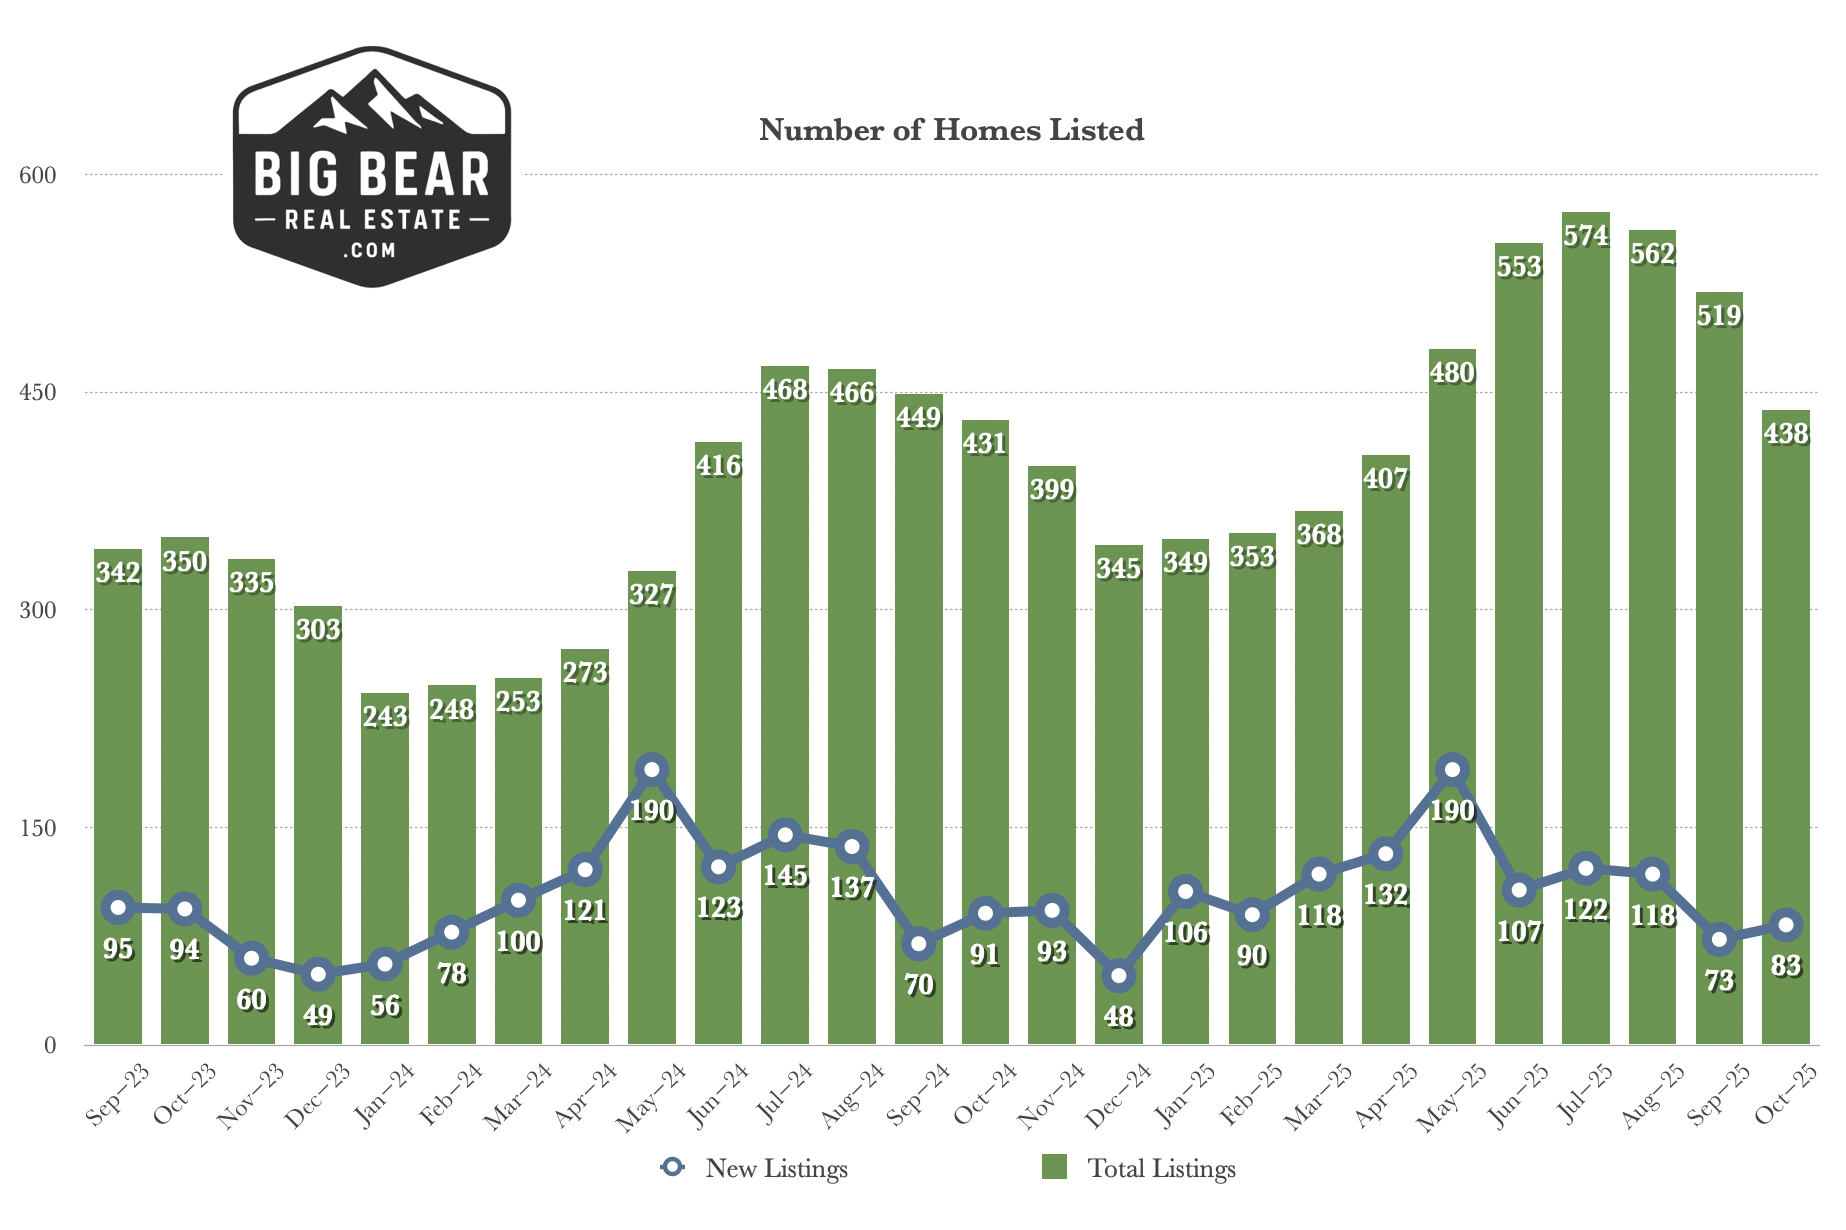
After peaking in late summer, inventory has been gradually trending downward. The total number of active listings* fell for the second consecutive month, from a high of 574 in July down to 438 in October.
New listings also declined to 83, compared to 118 in September — a typical seasonal pattern as fewer new properties hit the market before the holidays.
While total inventory remains 28% higher than this time last year, the slowdown in new listings could help stabilize prices in the months ahead as demand stays steady from buyers looking for ski-season homes and rental investments.
*Total listed inventory numbers as of the 15th of each month.
📈 Sales Activity
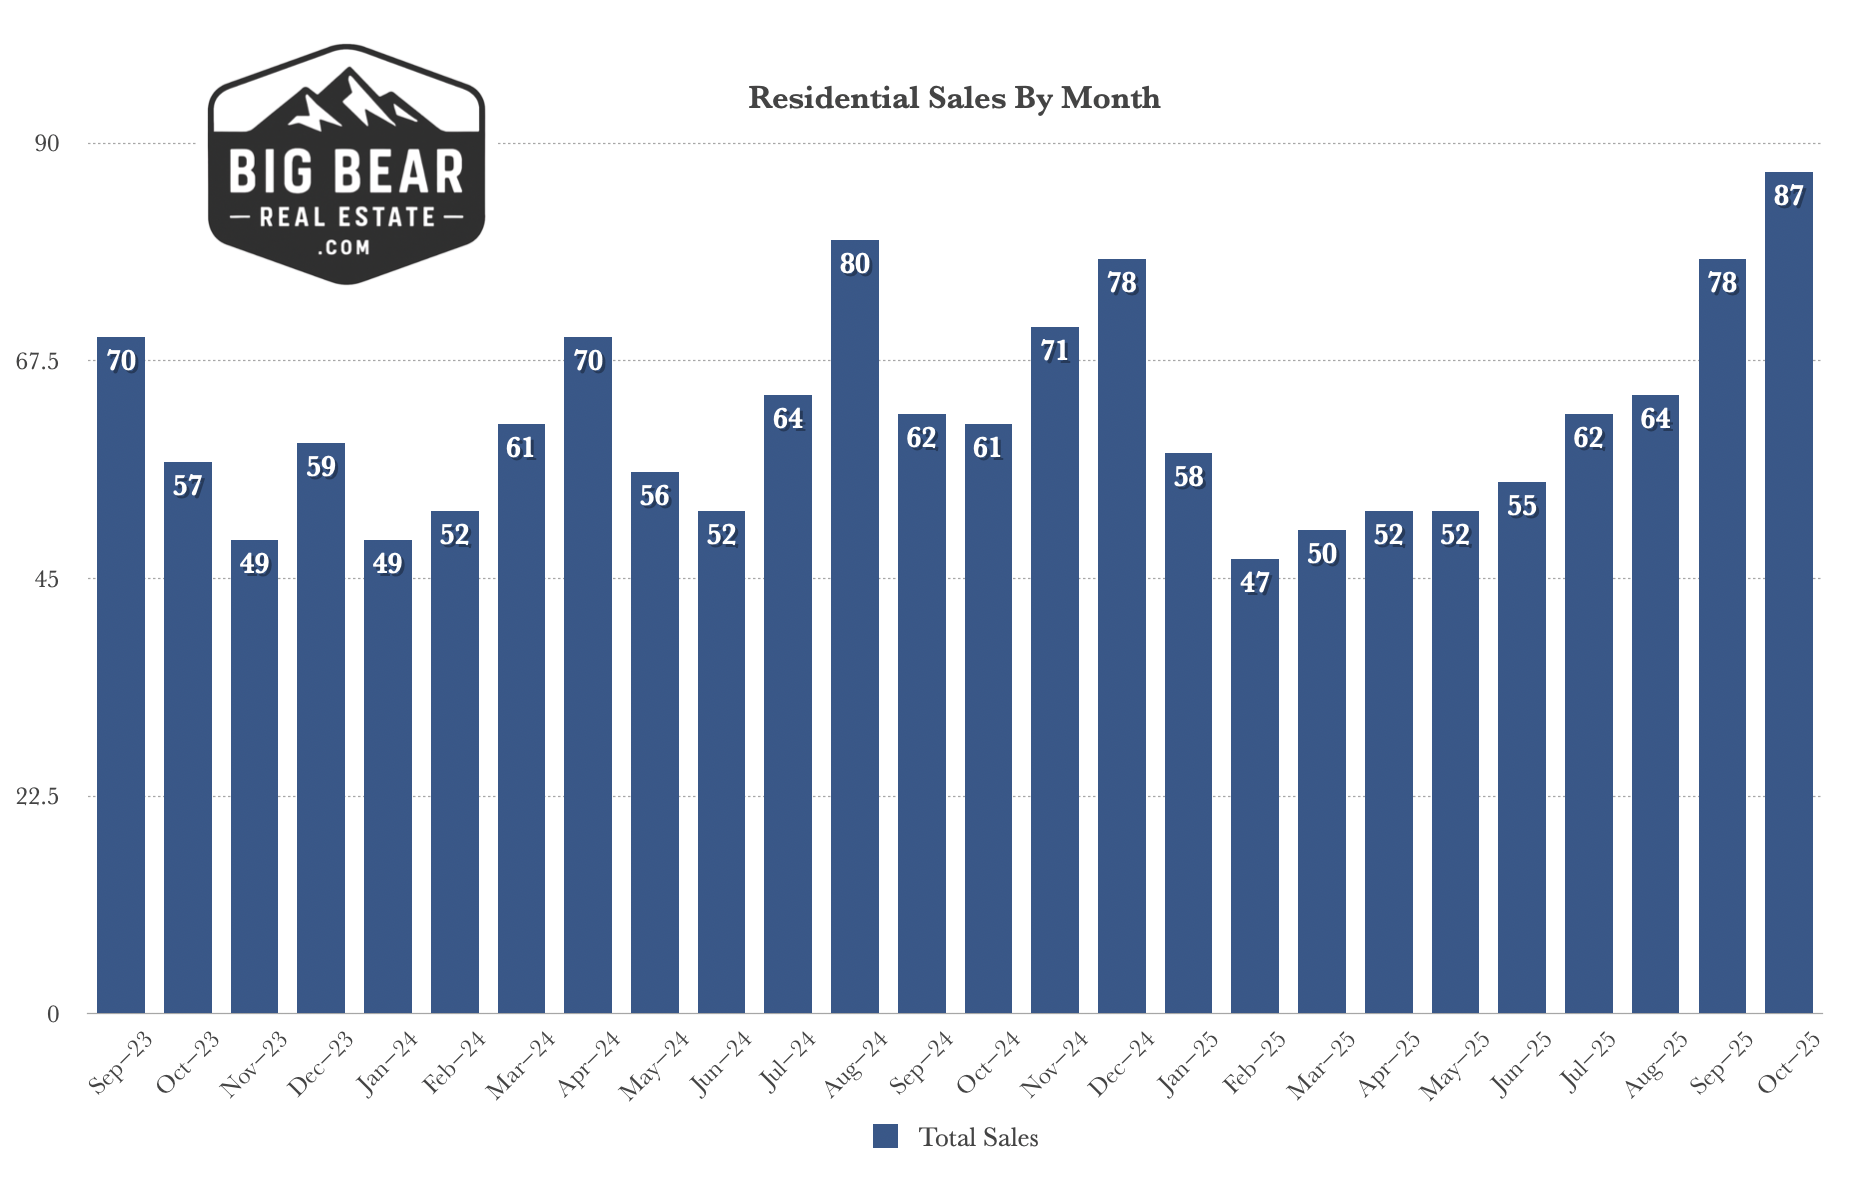
Sales activity surged in October — 87 homes closed, marking the strongest month of the year so far and a 12% increase from September’s 78 sales.
This upward trend is a promising sign that buyers are still active despite higher interest rates, likely motivated by improved pricing and motivated sellers.
Year-to-date, total sales are nearly on par with 2024 levels, down just 1%, showing overall market resilience through 2025.
🏔️ What It Means
The October data reflects a healthy and balanced market heading into the winter months. Prices rebounded from late-summer softness, inventory is tightening, and buyer activity remains robust.
As we move toward ski season, well-priced homes — especially those near the ski resorts or with rental potential — continue to draw interest.
If you’re considering buying or selling in Big Bear, now is an excellent time to connect with a local expert who understands the market’s unique seasonal rhythms.
Data derived from Big Bear Association of REALTORS®, Inc. (BBV) MLS. Information herein deemed reliable but not guaranteed.
Leave a Reply